Turning Grafana's alerting engine into an incident model operators can act on

TOKU builds real-time monitoring software for devices and sensors reporting on oil and gas assets in the field. The problem was that v4 inherited Grafana's alerting system built for engineers actively tuning rules. But those people are not our main users — our users need to act on those alerts. The hardest part of this project was getting everyone to agree on the project scope and incident definition and lifecycle once we built our own.
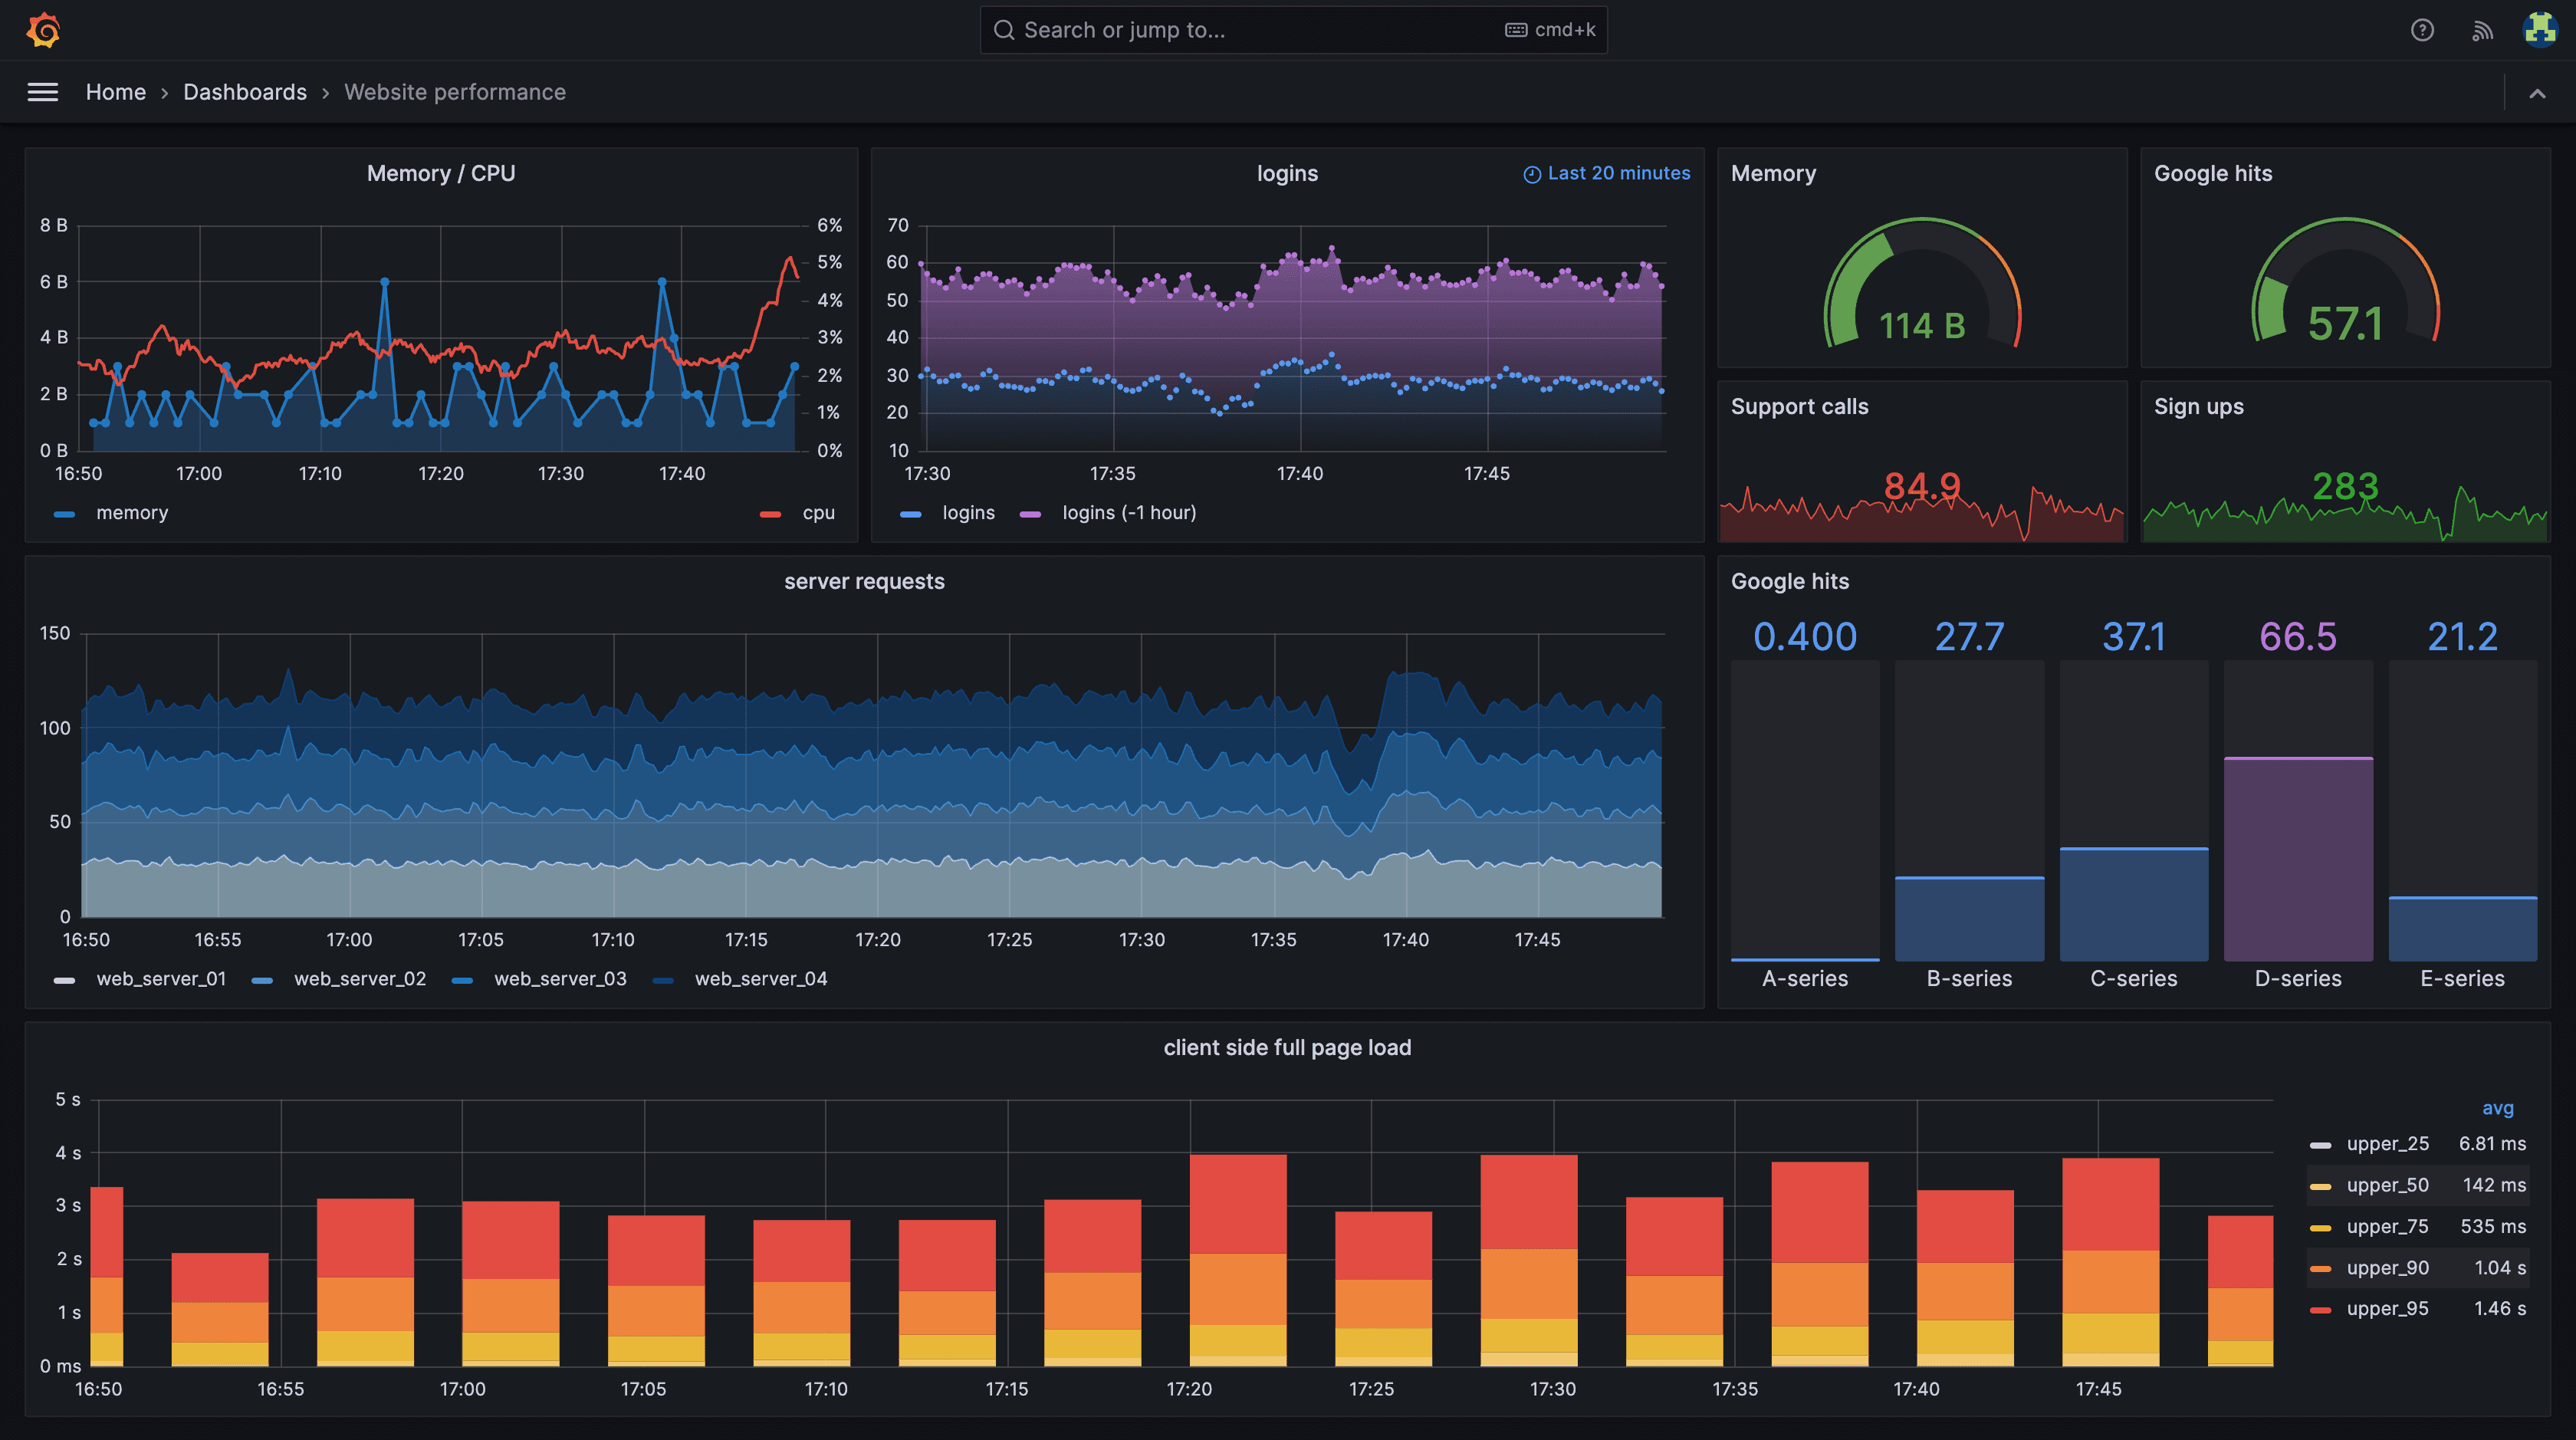

Problem Space
Why can't we just implement the alert system Grafana already gave us?
I tested the Grafana's native alerting
I first built a proof-of-concept and walked sales, engineering, and customer support teams through Grafana's native alerting rules.
My conclusion, three months in: not useful for our business — rules built for someone tuning configurations don't translate to a team that needs to act on alerts.

Complexity doesn't disappear.
Wiring the UI directly to Grafana's alert engine and shipping one flat list was the easy path. But exposing that configuration as-is would land the burden on staff first, and no customer could reasonably manage it either. Simplifying it was a core requirement, not an extra layer.
Here's what I found:
01.Configuration complexity.
Each alert rule tracks its own instance lifecycle (Pending, Alerting, Recovering, No Data, Error) per label combination, and instances are grouped by labels not designed around an operator’s decision-making.

02.One clock doesn't fit a thousand devices.
Our devices are set to call in roughly hourly, but weather and signal conditions push individual call-ins later. Across roughly 1,000 unsynchronized devices, call-ins were never going to land on a shared clock. A single fixed “expected interval” applied fleet-wide would misfire constantly.

03.Terminology friction.
Pending period, mute, evaluation group, evaluation frequency — real vocabulary a rule-builder needs to reason in. Hand that vocabulary to staff or customers as-is, and the burden of learning it lands on them before they can do anything useful with the tool.

04.Existing false positives.
v3 already had four alert rules configured, but each fired on a single breaching reading. There was no averaging, no recovery period, and no ability to silence a known issue. A rule that can’t average and can’t recover can’t distinguish a one-off dip from a real trend, so it fires repeatedly on the same transient condition.
05.No digest, no synthesis.
There was no daily or weekly rollup, and no tool that synthesized the incident stream into anything reviewable at a glance. The only way to consume incidents was one at a time, as they arrived. (Grafana open source version)
Pain points
What triage actually looked like

Before IRM, TOKU’s device fleet surfaced problems mainly through email. The manual workflow looked like this: an alert email arrives, customer support manually pulls trend data in our software to sanity-check it, cross-references a device-status spreadsheet for context, then goes sleuthing for the right customer contact before hand-typing a support ticket. If it doesn’t get resolved, it escalates to a second spreadsheet for the repair team.
The pain was entirely manual and duplicated across tools. One cloudy week generated roughly 500 open incidents, 70% transient low-battery readings that resolved on their own. Every one still triggered a full manual triage. At that volume, an alert stops meaning anything.
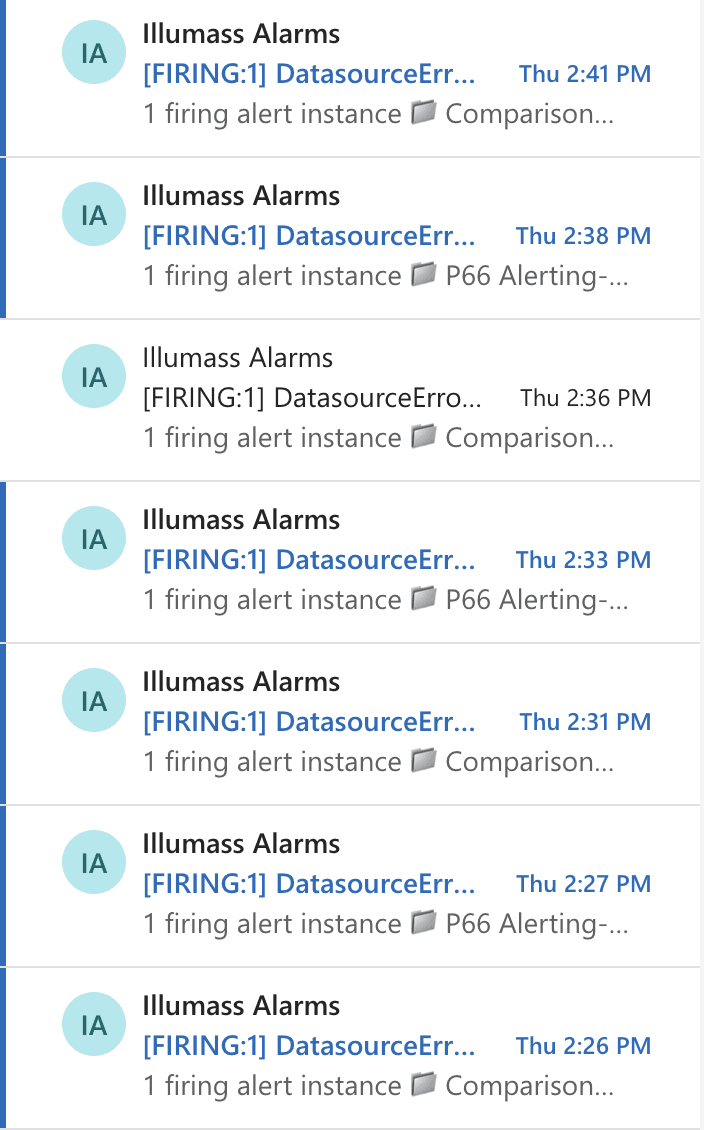
The flooding alerting email in 20 mins

The email looks like to communicate the urgency of issues.
“There are a lot of items still kind of manually done… I think that’s why we analyze device health instead of customers—we didn’t want to flood them, and there will be hundreds of alerts per day.”
Solution: System model
The model, end to end

Two design decisions live in this shape
Alert instances are backend only. Only three states will reach our customer.
Category is decided at the Alert Rule. Health and operational signals evaluate on a frequency; data gaps evaluate on data arrival. Category also decides who gets notified and what shows on a customer-facing incident.
Solution: Design
Three design principles held the model together
Rationalization
Only devices that need action are surfaced as alerts. Everything else stays quiet, so visibility actually means something.
Deduplication
One incident, not a flood. A firing alert opens or updates a single incident — a device or asset can only have one open incident at a time.
Shelving, not silencing
Silence always expires. An operator can shelve a known, stable incident for up to 90 days instead of muting it permanently. If severity escalates while shelved, the system reopens it automatically.
Rationalization
#1 The category split
Device health (battery, uptime, late calls-in, data gaps) split cleanly from operational alerts that customer already owns (temperature, pressure). Alert type now decides who gets notified and what appears on a customer-facing incident.
#2 Critical-only on the first screen
The Welcome dashboard is customer support’s first screen on login. Showing every open incident there would bury what needs action under lower-priority alerts. The incident table now lists critical incidents only, per customer.

#3 The wizard optimization

Each signal now starts as a collapsed checkbox card. Checking it expands into its own thresholds.
The layout itself teaches the real model: these are three independent rules, not one rule with three conditions.

Deduplication
#4 Two panels, two different jobs
An incident view was trying to answer two different questions at once: what needs attention right now, and what actually happened over time. The left panel now shows current, actionable state, one row per incident, severity-sorted, with inline resolve and silence actions. The right panel shows the full point-in-time alert log, reverse-chronological, ungrouped. Triage and investigation are separated instead of competing with each other.
#5 One incident per device/location
South Point 3 is the concrete case: a late call-in, a battery voltage drop, and a temperature spike all fired on the same device in the same window. All six alerts land in one incident, not three. Each device’s history is also bounded by its own Resolved record, so a closed incident can never appear reopened when a new one arrives.

Shelving, not silencing
#6 Shelving
De-escalation while shelved stays shelved, so an operator who dismissed a warning isn’t renotified every time the condition briefly recurs. Escalation always breaks the shelf and forces the incident back to Open. Shelved routes directly to Resolved instead of forcing a trip back through Open first.


Design Intervention
One source of truth, kept in sync with AI artifact
None of the above got resolved by design working in isolation. I created an AI artifact to sync and align all decisions after every meeting. Every decision went into one versioned wiki page (v2.0 → v2.6) as the model evolved. A data model this contested needs a place decisions can be looked up and disputed against, and getting product and engineering to actually agree on it, in the room, mattered more than any mockup would have.

The impact
Validated with the team

As for August 2026, Device Health/IRM has moved from a first-draft phased design through a validated alert-rule/incident lifecycle model confirmed with PM & head of engineer, with the handoff files already defined. The build itself is scoped into v26.4 on the roadmap. A later session split “device health” further into device health and system health, since gap-detection issues turned out to interest a different audience.
Process highlight
My approach when things didn't go as expected
#1 Taking control of a stalled process
Three product meetings couldn't align on scope. Ideally, design comes in once the project is already defined. In reality, that wasn't happening. With that ambiguity, design won't be able to get it right.
I audited our documentation before each follow-up, turned the topic into action items, and pushed the agenda so meetings resolved questions instead of relitigating them. This in case the design direction got questioned, I could point back to the source of truth directly.
My role here wasn't to draw for longer; it was to make sure the decision actually happened.

#2 A four-phase roadmap
We split the rollout into four phases instead of designing everything at once. Phases 1 and 2 stay internal to TOKU staff. Customer notifications and self-service rules wait until Phase 3. Design handoff files clearly follow the phase and refine as needed.
Customers see alerts scoped to their own assets and manage their own rules.
Daily/weekly digest, Work schedule, and fleet level alerts. Iterate on direct customer feedback.
A trust ladder, not a feature list.
#3 Stress test the system model with use cases
Syncing what an incident actually was took longer than building any single screen. To find where it would break, I built a user flow and stress-tested it against real work examples pulled from the fleet. The first two data models both broke on contact.

Interested in the full case study?
Please feel free to reach out to learn more about this work and my process in detail.
Type
Product
, IOT Dashboard
Date
May, 2026-now
Framework & Tools
Figma, User Journey Map, FigJam, Claude code, Google stitch, Codex
Role
User Research + UI/UX+ Product Design
Outcome
Webapp/Mobile app/PRD
Team (6)
Vanessa Chang(me), 2 engineers, 1 product manager, 1 customer support, 1 sales


Thanks for visiting!
Shoot me an email if you'd like to chat.
© Vanessa Chang 2026 | All rights reserved